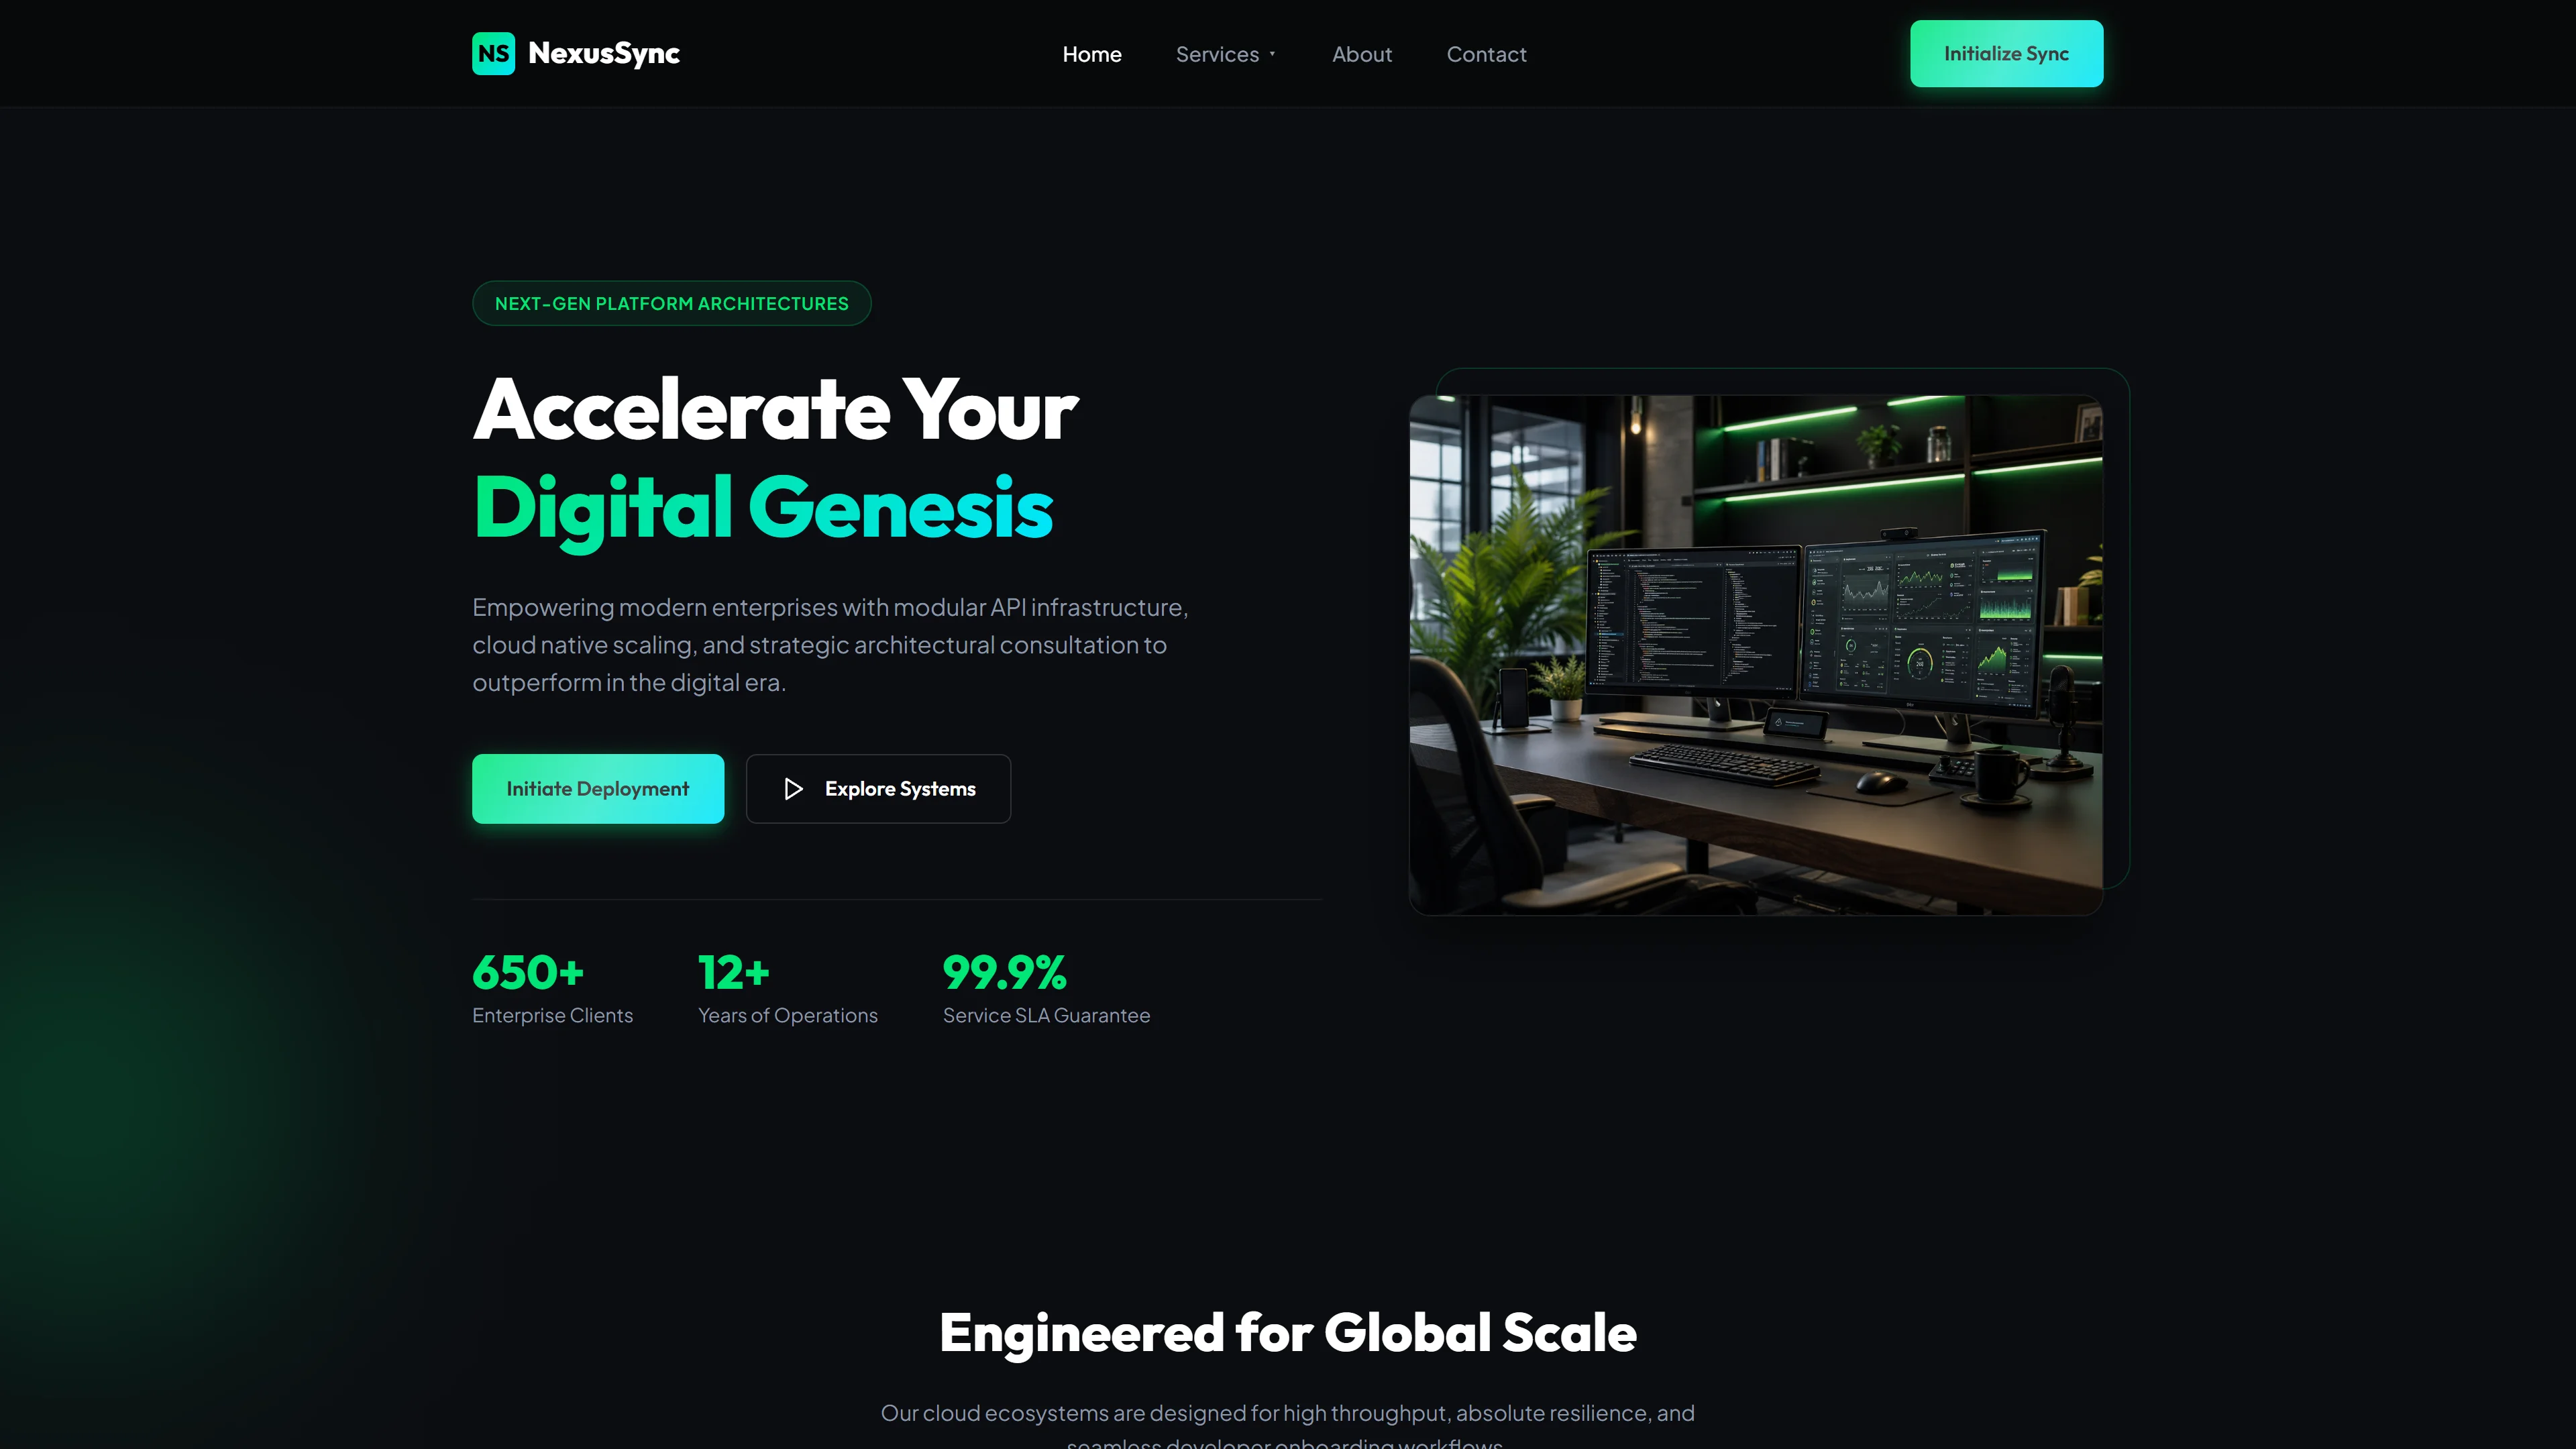
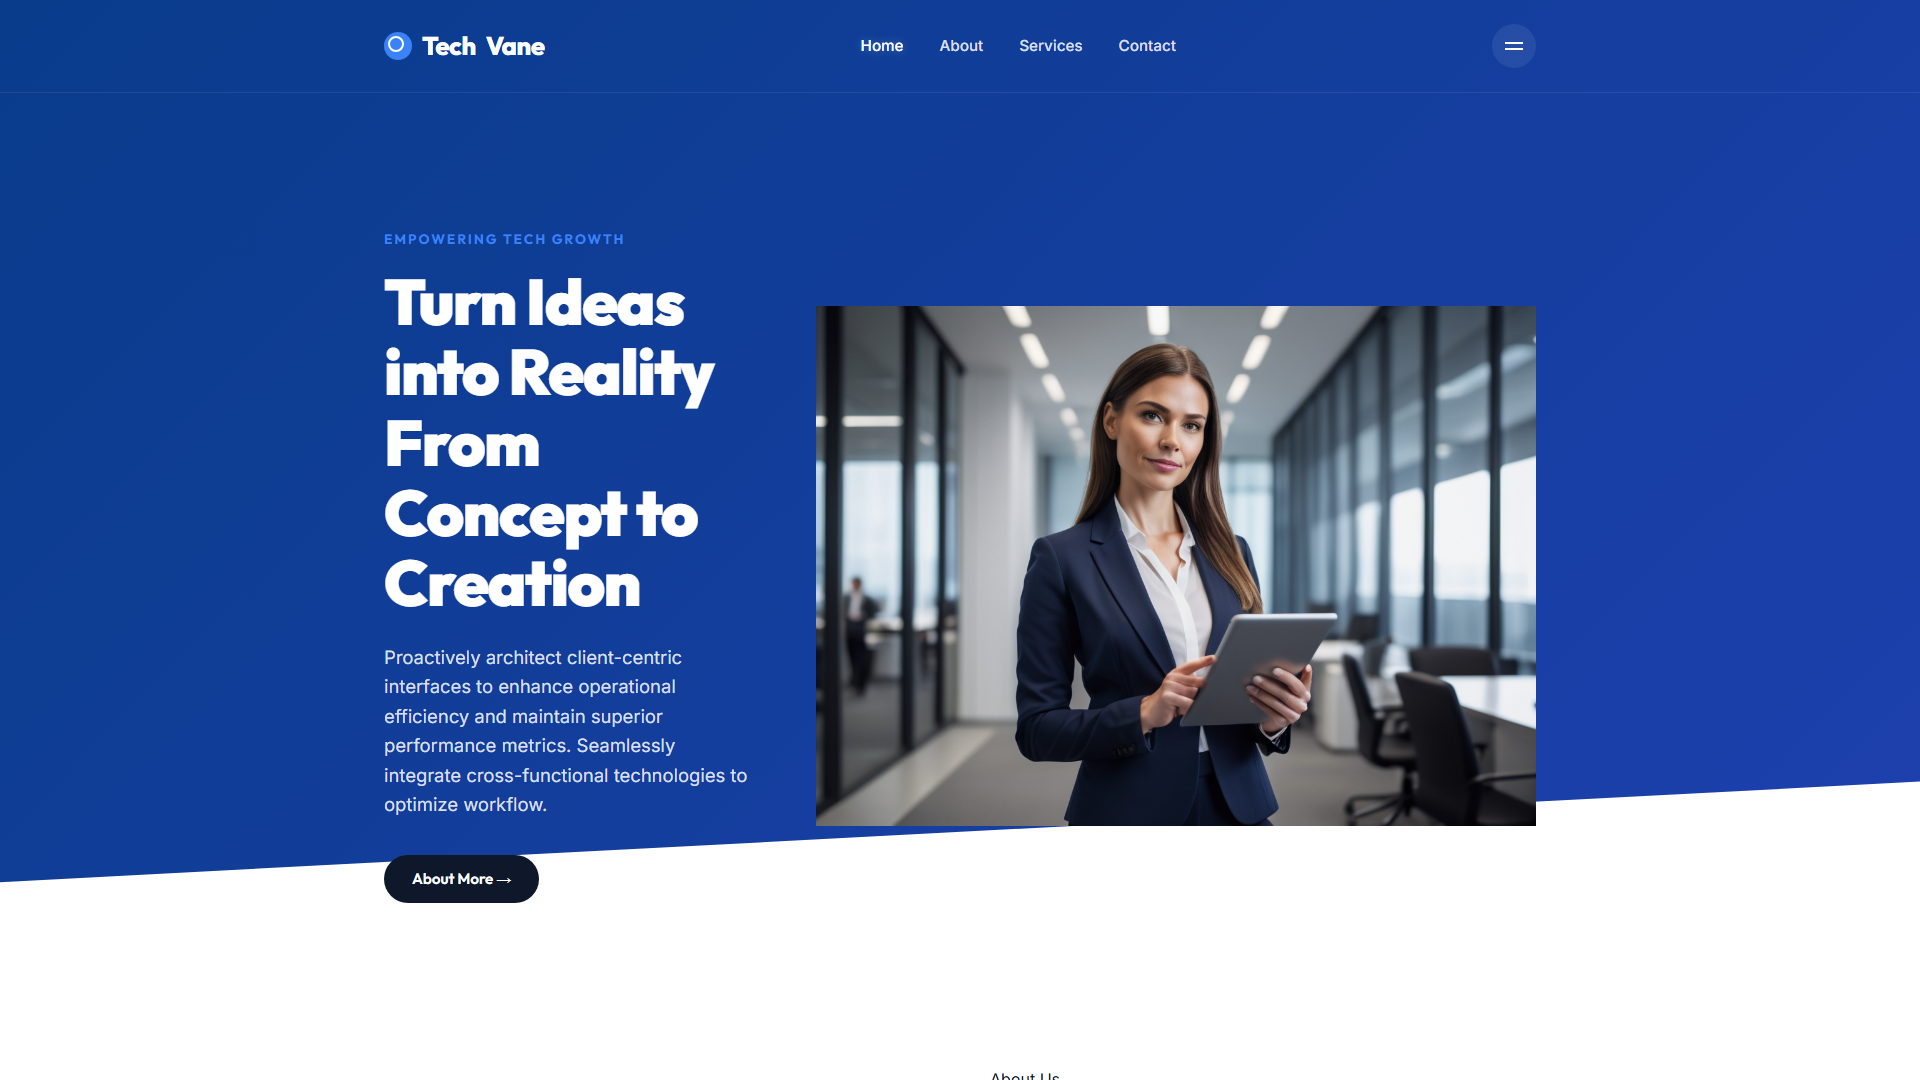
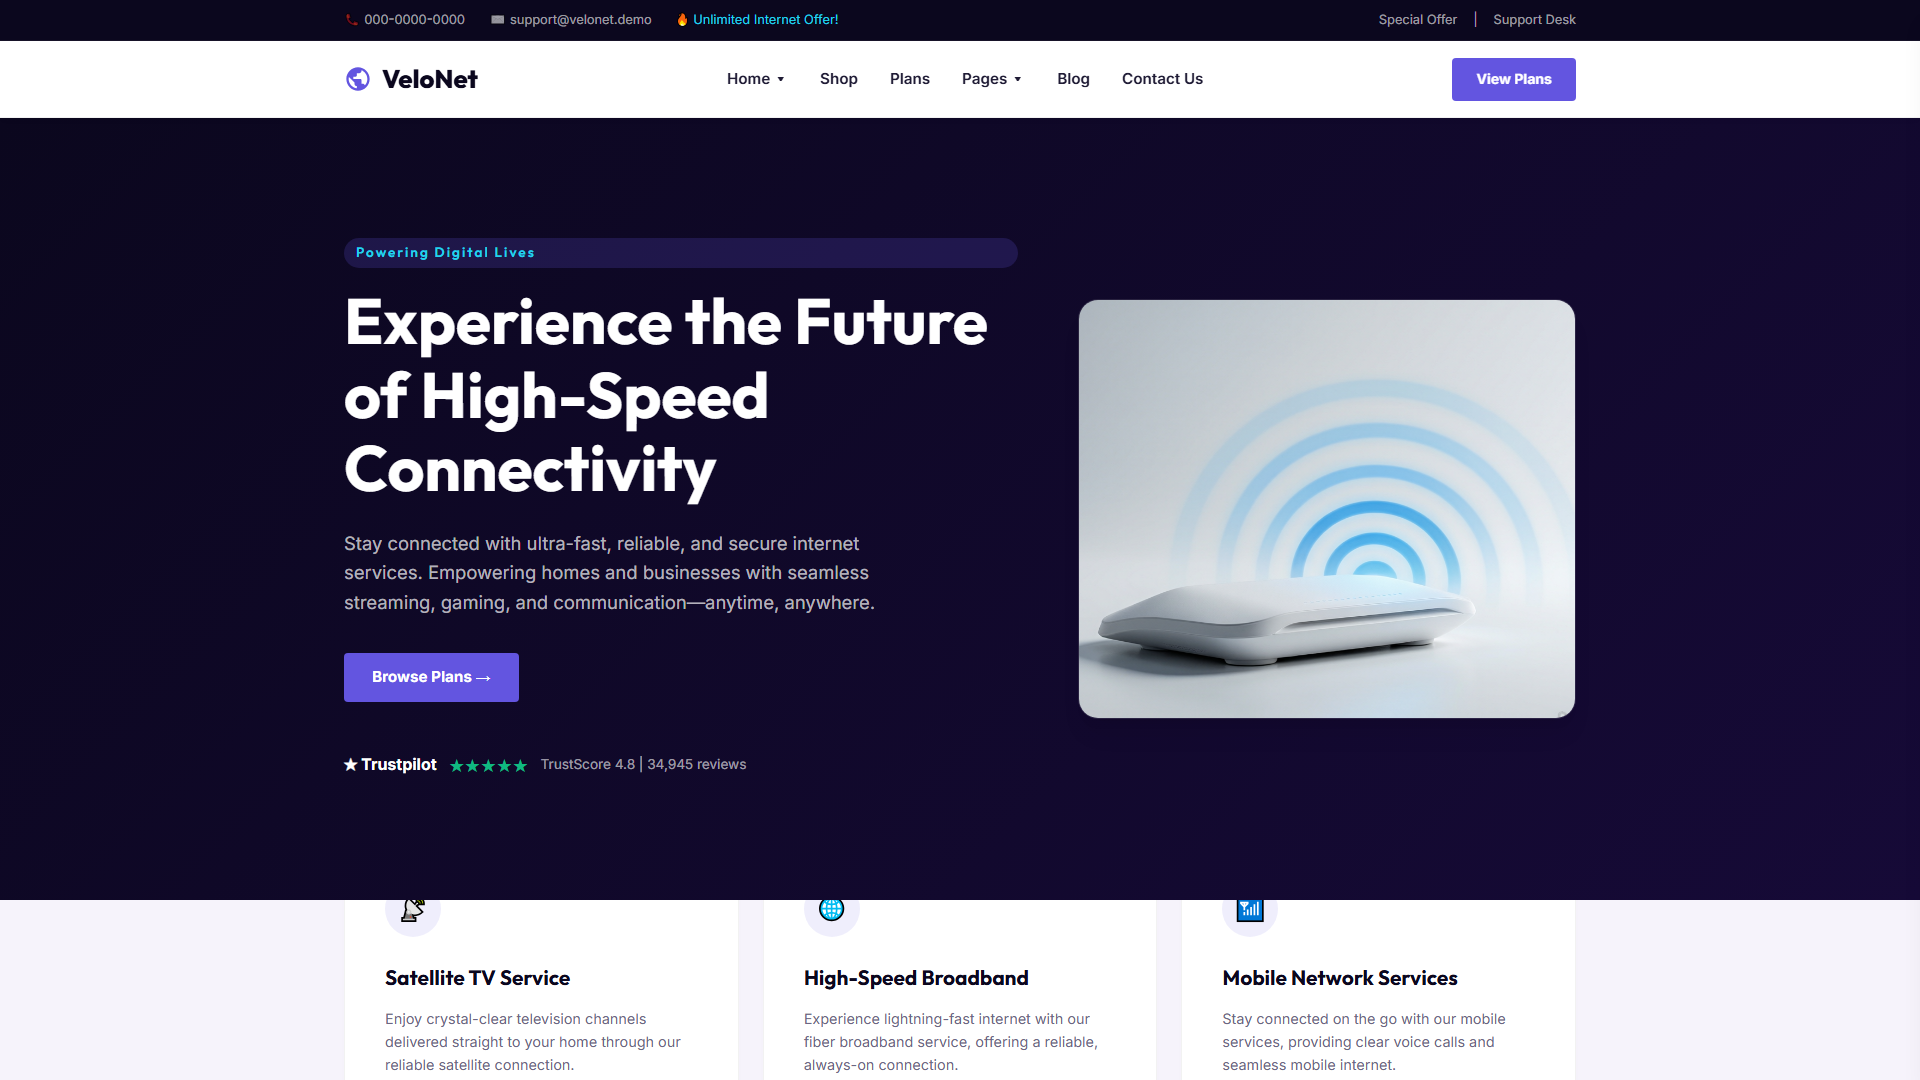
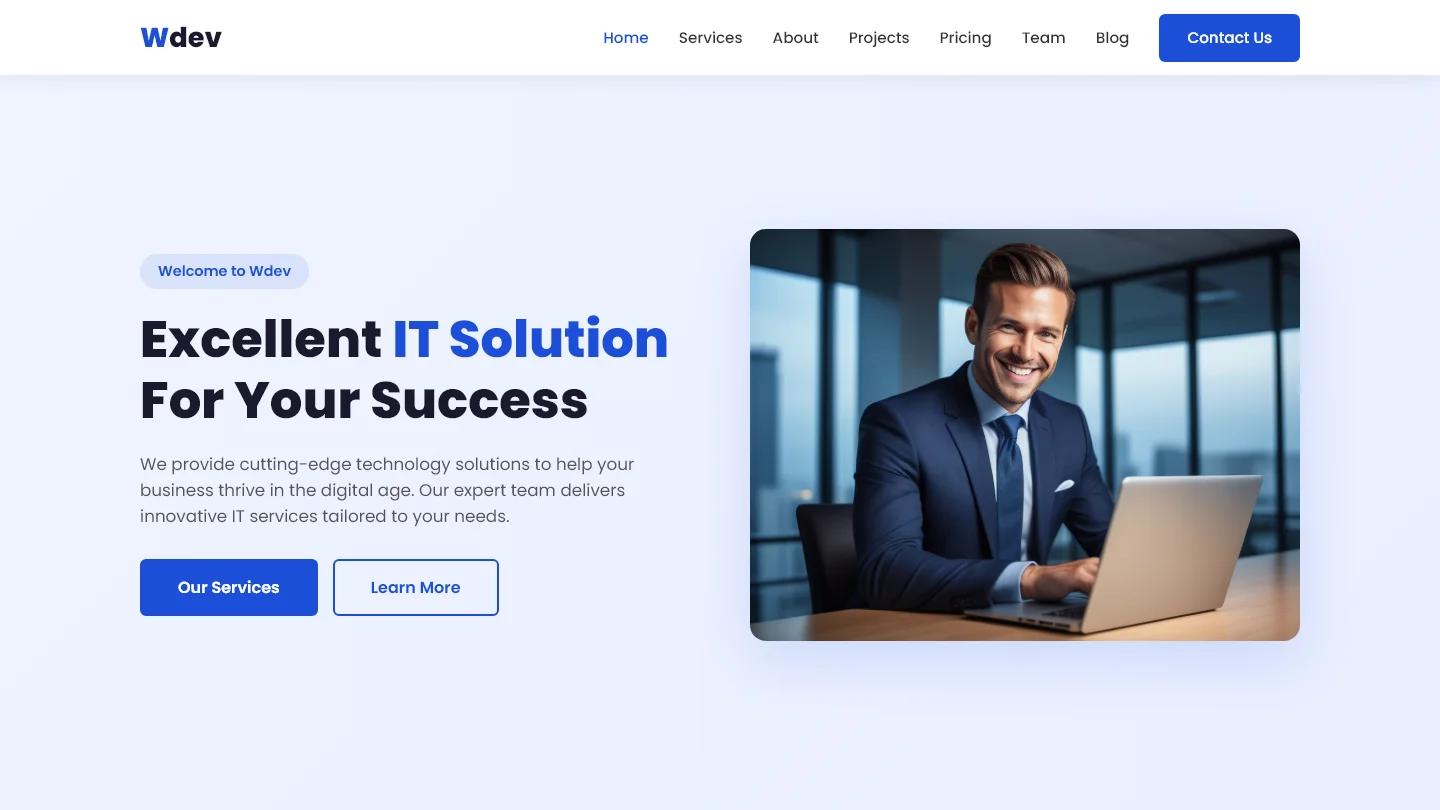
ITSolutions — Free IT & Software Website Template
ITSolutions is a free HTML5 template built for IT consulting firms, managed service providers, and software companies that need a professional online presence without bloat. The package contains 9 hand-coded pages — homepage, services, about, portfolio, project detail, service detail, blog detail, and contact — all styled with Tailwind CSS and hand-written CSS overrides. A contact/newsletter form is included for lead capture.
The layout is fully responsive with a 768px breakpoint that collapses grid sections into a single column for mobile readability. Semantic HTML5 and ARIA labels are used throughout for accessibility. The included 10 local images are placeholders ready for your own assets, and Google Fonts is the only external dependency loaded.
Section order on the index page follows a logical sales flow: hero headline, service overview, process explanation, client trust indicators, project portfolio, testimonials, and a final call-to-action. This structure lets visitors understand your offerings before committing to reach out.
Key Features
- Data Visualization Dashboards
- Customer Behavior Tracking
- Real-Time Reporting Engine
- API-First Architecture
| Tech Stack | HTML5, Tailwind CSS, JavaScript |
| Release Date | 2026-07-05 |
| License | Free (Must keep footer backlink) |
Suitable For & Use Cases
IT consultants, data agency owners, SaaS founders offering analytics services, and freelance BI specialists targeting mid-market businesses. Ideal for landing pages, client onboarding dashboards, or pitch decks. Not suited for e-commerce stores or content-heavy blogs where visual storytelling takes precedence over data presentation.
Page Sections Included
The index page contains sections for Drivng Digital Innovation, Comprehensive IT Solutions, Enterprise-Grade IT Solutions, Our Process, Clients Who Trust Us, Completed Projects, What Our Customers Say, and Let's Talk About Your Project. The template also includes dedicated pages for About, Services with detail views, Portfolio with project details, Blog with individual posts, and Contact functionality with forms. Local images are provided for placeholder content, and Google Fonts handles typography externally.
Why We Recommend
Most IT templates either over-design for agencies that don't need charts or underserve firms that need to demonstrate technical credibility. ITSolutions sits in the middle — clean typography, clear section hierarchy, and enough room for service cards and project showcases without unnecessary visual noise. The form is ready to hook into any backend. Deployment is straightforward, and the small library footprint keeps the bundle lean.
Technical Specifications
Built with HTML5, Tailwind CSS, and vanilla JavaScript. Google Fonts is the only external library. CSS is hand-written alongside Tailwind utility classes. No build step is required to run the template locally — open index.html in a browser. Replace placeholder images with your own assets. Customize colors and spacing through Tailwind config if desired.
Ideal Use Case
Managed IT service providers can use this template to present their service tiers alongside a process explainer and client logos, then direct visitors to the contact form for a quote request. Software development shops can swap the default sections into a portfolio-first layout using the project-detail and service-detail pages. Local MSPs building their first site get a complete 9-page structure with no build complexity.